
How to Review a Course's Website Traffic & SEO
Open a course from the Courses list and go to its Analytics tab, then the Website Traffic & SEO section. It shows how that course's public page is performing in Google Analytics and Google Search Console — separate from enrolment and revenue analytics.
Use the 7d / 30d / 90d switch at the top right to change the reporting window; every number on the page updates for that range.
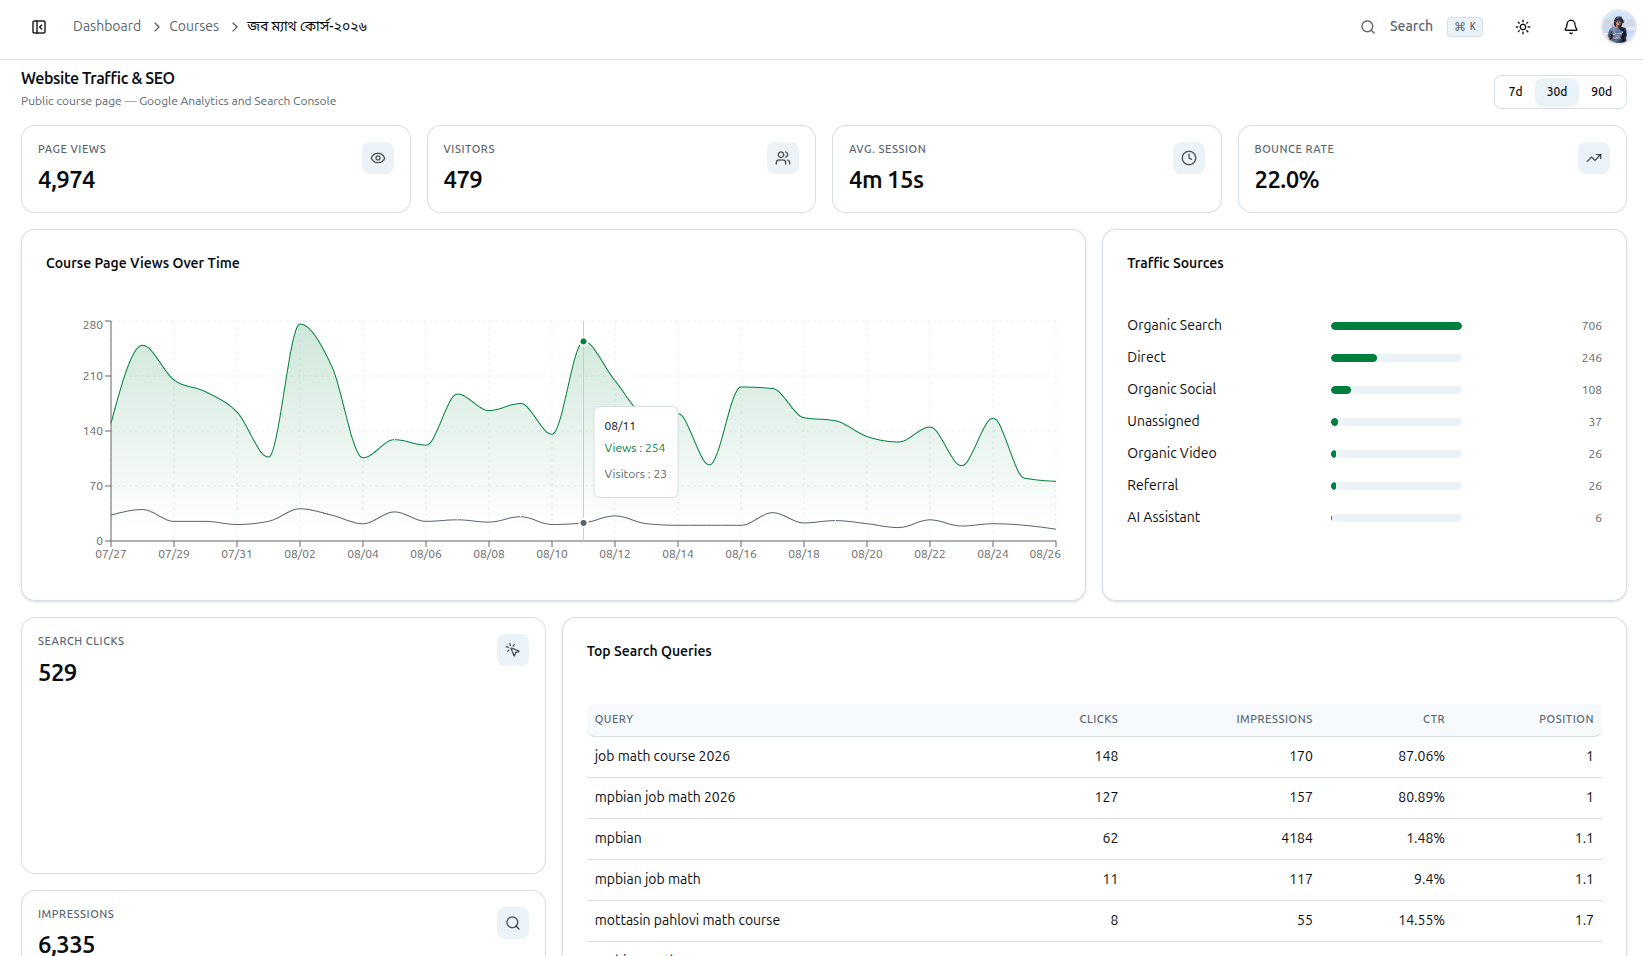
Top Stat Tiles
- Page Views — total views of the public course page
- Visitors — unique visitors to the page
- Avg. Session — average time a visitor spends on the page before leaving
- Bounce Rate — the share of visits that leave after viewing just one page; lower is better
Course Page Views Over Time
A line chart plots daily page views (and a secondary trend line) across the selected date range, so you can spot spikes — for example after a promotion or a social post — at a glance.
Traffic Sources
A breakdown of where visitors came from, each with a bar and a raw count:
- Organic Search — arrived via an unpaid Google (or other search engine) result
- Direct — typed the URL or used a saved bookmark
- Organic Social — arrived from an unpaid social media post or profile link
- Unassigned — traffic Google Analytics could not attribute to a channel
- Organic Video — arrived from a video platform such as YouTube
- Referral — arrived by clicking a link on another website
- AI Assistant — arrived via a link surfaced by an AI chat/assistant product
Search Console Data
- Search Clicks — total clicks from Google Search results to the course page
- Impressions — how many times the page appeared in Google Search results
- Top Search Queries — a table of the actual search terms people used, each with:
- Clicks — how many of those searches led to a click
- Impressions — how many times that query showed the page in results
- CTR — click-through rate, clicks divided by impressions
- Position — the page's average ranking position for that query (lower is better; 1 means top result)
Use the Top Search Queries table to see which keywords are already bringing students in, and which high-impression, low-CTR queries could use a better Meta Title or Meta Description — see How to Configure SEO.
If neither Google Analytics nor Search Console is connected for your site, this section stays empty. Connect them from Integrations — see Manage Integrations.
Related: Managing Course Details & Content · How to Configure SEO · Dashboard Analytics Overview