
3. Analytics Tab: Revenue Trends & Breakdowns
Owner only. This tab doesn't appear for teachers or moderators, even ones with payments access — only the organization owner sees Analytics.
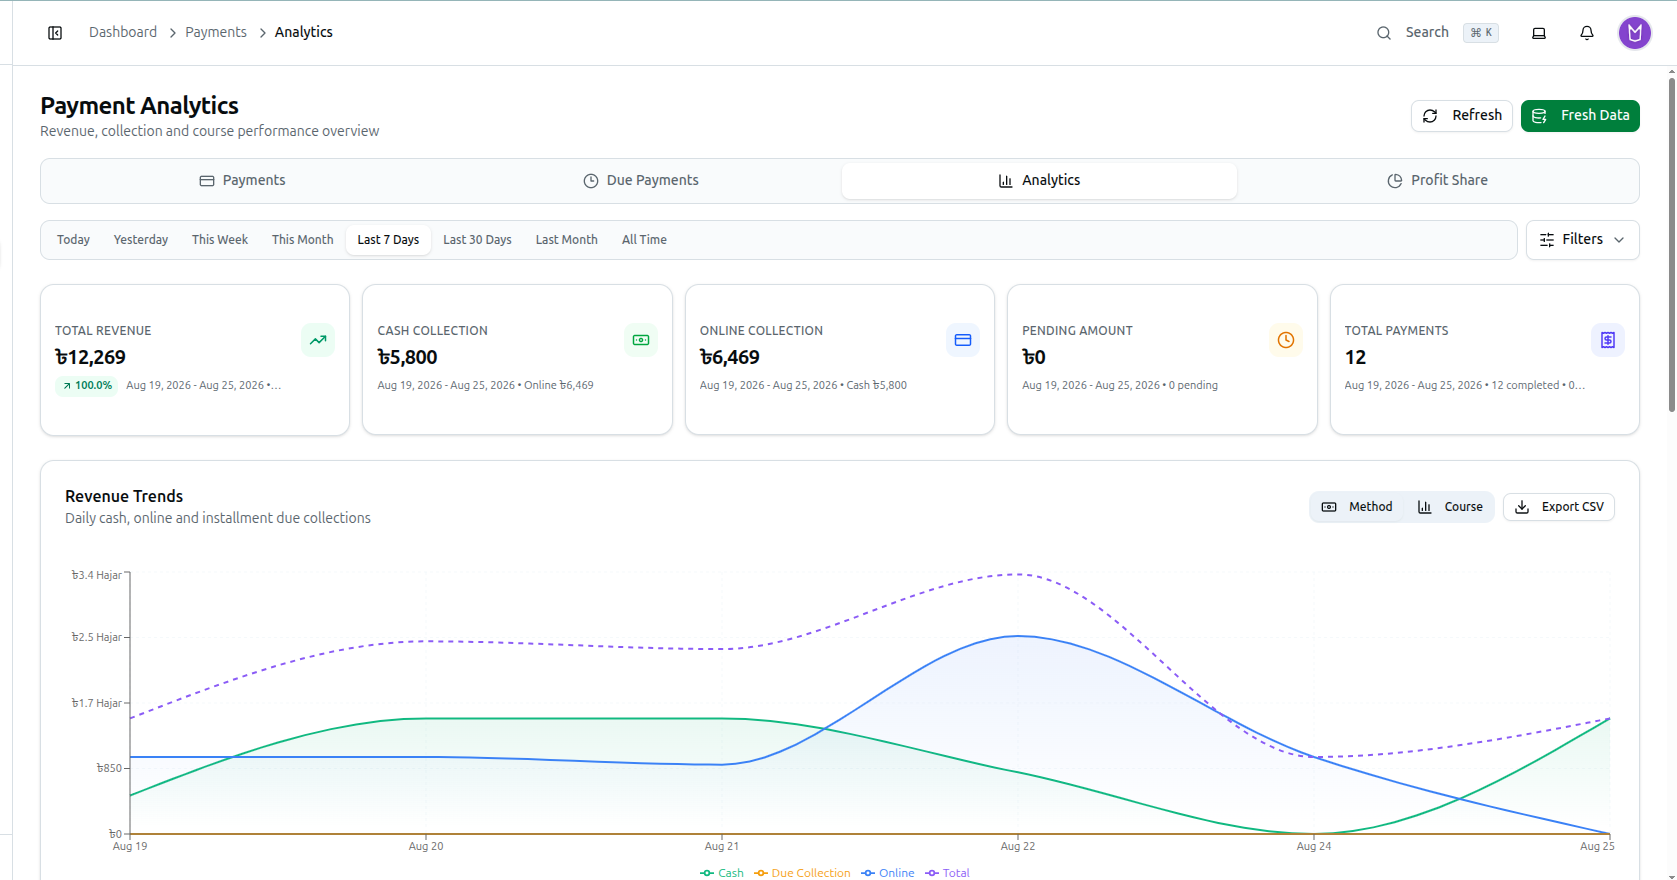
Date filtering: a row of quick presets — Today, Yesterday, This Week, This Month, Last 7 Days, Last 30 Days, Last Month, All Time — plus a Filters dropdown for a custom range using two separate date pickers (From / To). Clear all lives with the active-filter chips, not the date presets, and resets everything at once.
Product scope: a Product Type dropdown — Books & Courses (default), Courses only, or Books only — plus a multi-select to isolate specific courses and a single-select for one specific book.
Five summary cards: Total Revenue, Cash Collection, Online Collection, Pending Amount, and Total Payments (showing a completed/pending breakdown).
An earlier version of this guide listed only four cards and missed Pending Amount entirely. It sits between Online Collection and Total Payments, and shows the pending + online-pending total for the selected period.

Refresh vs. Fresh Data — these are not the same button. Refresh simply re-fetches with your current filters, which can still return server-cached numbers. Fresh Data clears the server-side analytics cache (which normally holds for an hour) and recomputes every figure from scratch — slower, and meant for right after you've corrected a payment record and need the numbers to reflect it immediately.
Revenue Trends Chart
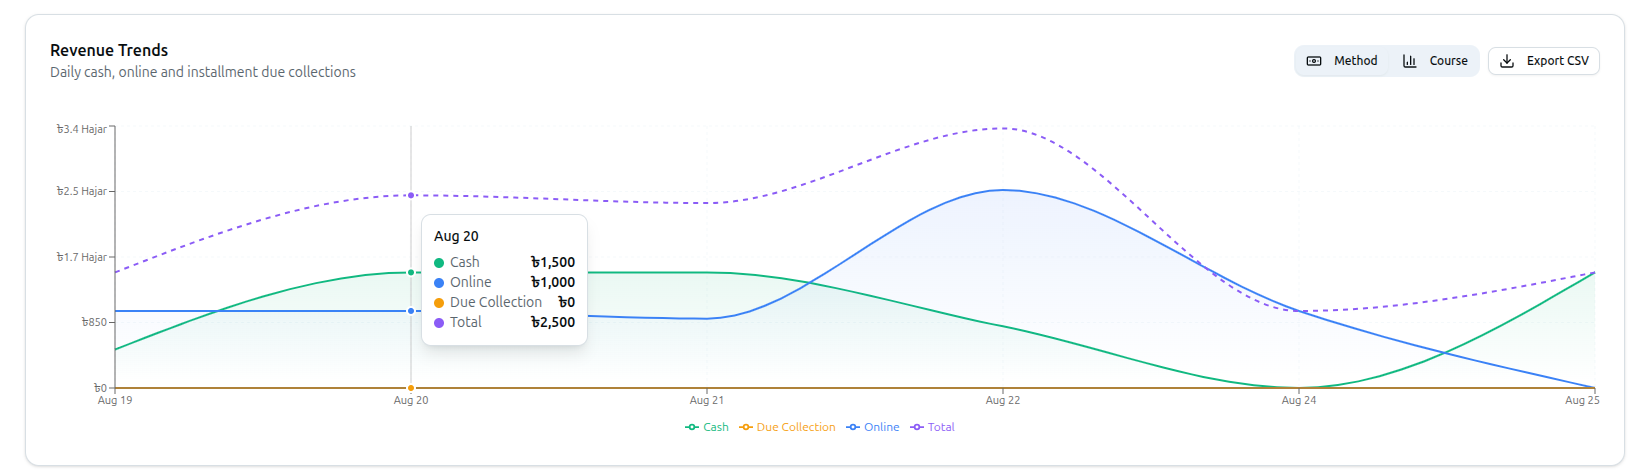
Toggle between Method and Course view. Method view plots four lines: Cash, Online, Due Collection, and a dashed Total. Course view instead plots one line per course, drawn dynamically for whichever courses are in scope.
Export CSV opens a small modal: it exports daily payment-method trends with an extra clearing_period_sum column grouped by weekly clearing periods. Pick your Clearing day (Monday through Sunday) and click Download CSV.
The Course Analytics Table
Two tables described in an earlier version of this guide — "Category Analysis" and "Course-wise Breakdown" — do not exist in the product. There is one real table here, titled Course Analytics, and its columns and controls are different from what was previously documented.
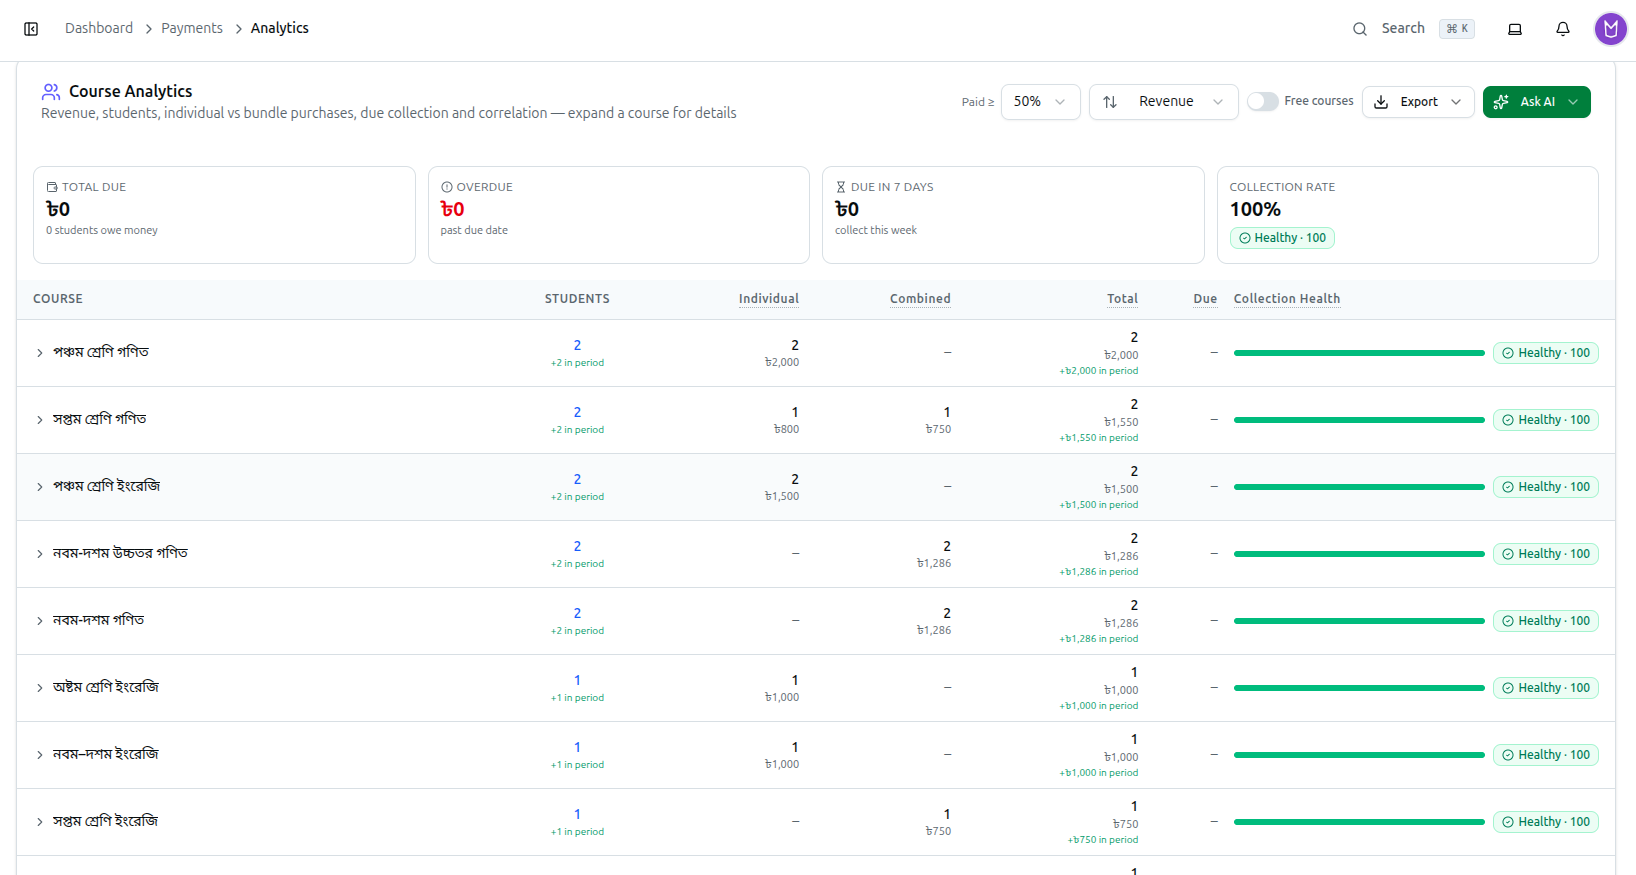
Its own subtitle describes it precisely: "Revenue, students, individual vs bundle purchases, due collection and correlation — expand a course for details."
Four stat cards sit above the table, organization-wide across every course shown: Total Due (amount owed, with a count of students who owe money), Overdue (amount past its due date), Due in 7 Days (what to collect this week), and Collection Rate (a percentage plus a Healthy / Warning / Critical health badge).
Table columns: Course, Students, Individual, Combined, Total, Due, and Collection Health. Individual counts students who bought that course on its own; Combined counts students who got it as part of a bundle — a course sold both ways shows both numbers side by side. A Free courses toggle includes or excludes free courses from the table. Click a row to expand an Enrollment Breakdown panel underneath it — the previous/new-in-period comparison lives there, not in dedicated columns.
Above the table: a minimum Paid ≥ amount filter, a sort dropdown, an Export dropdown (JSON, CSV, or Copy LLM Prompt), and an Ask AI dropdown for querying the data conversationally.
Troubleshooting
| What you see | What it means |
|---|---|
| The Analytics tab isn't in your sidebar | It's owner-only — log in as the organization owner, or ask them to check the numbers |
| Numbers look stale right after fixing a payment | Click Fresh Data, not Refresh — the server caches analytics for an hour |
| Looking for "Category Analysis" or "Course-wise Breakdown" | Those tables never existed — the real one is Course Analytics, with a different column set |
| The revenue chart looks different from what you expected | Method view has 4 lines (Cash/Online/Due Collection/Total), not 2 — switch views with the Method/Course toggle |
Related: Payments Module Overview · Profit Share Tab · Payments Tab