
Website Analytics is a dedicated page showing real traffic on your public website — visitors, page views, where people come from, what they search for, and how well your pages are set up for Google. It is separate from your main Dashboard: the Dashboard's own "Website Analytics" card only shows a small 24-hour snapshot and a View All button that brings you here.
Open it from the left sidebar: Platform, then Website Analytics (/dashboard/website-analytics).
This page runs on two outside services you connect yourself: Google Analytics 4 (GA4) — Google's free traffic-tracking tool — powers everything except the SEO tab's search data, and Google Search Console — Google's free tool for how your site performs in Google search — powers that search data. Nothing on this page works until at least GA4 is connected; see If Nothing Is Connected Yet below.
The Header
- Your domain, next to a small external-link icon — click it to open your live site in a new tab.
- A pulsing "N active now" badge, shown only while someone is actually on your site.
- Reporting period — Last 7 days, Last 30 days or Last 90 days. Changing it refetches every tab, not just the one you're looking at.
- Refresh — re-pulls the current period's data without waiting for the next auto-refresh.
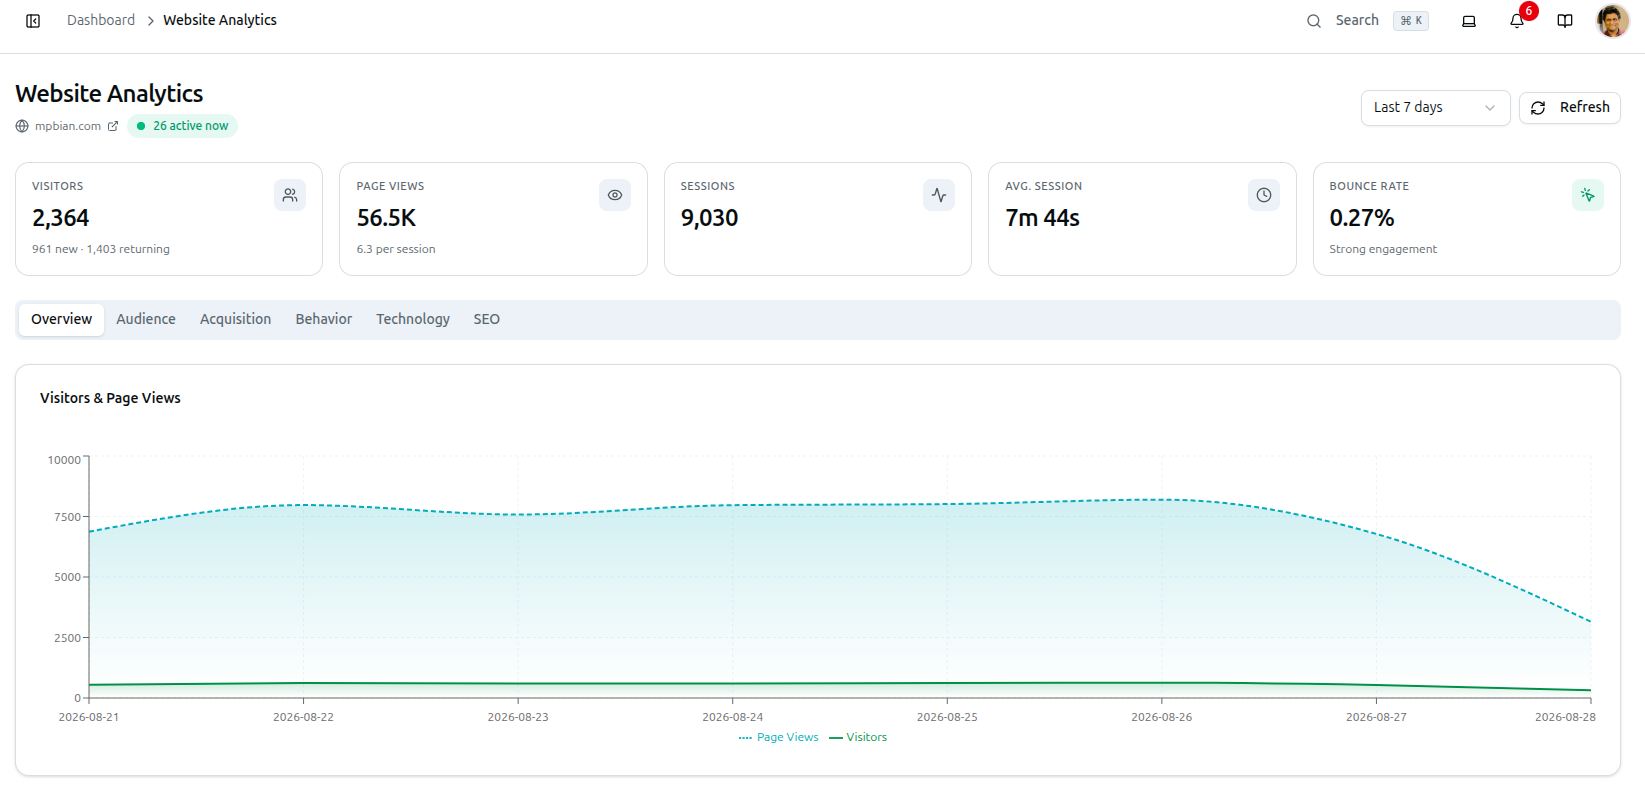
Five key numbers sit above the tabs, covering the whole selected period: Visitors (with new vs. returning underneath), Page Views (with views-per-session underneath), Sessions, Avg. Session (duration), and Bounce Rate — colour-coded: above 70% is flagged "High — visitors leave fast," below 40% "Strong engagement," in between "Within a normal range."
Overview Tab
Your daily traffic at a glance:
- Visitors & Page Views — a line chart of both, day by day, across the selected period.
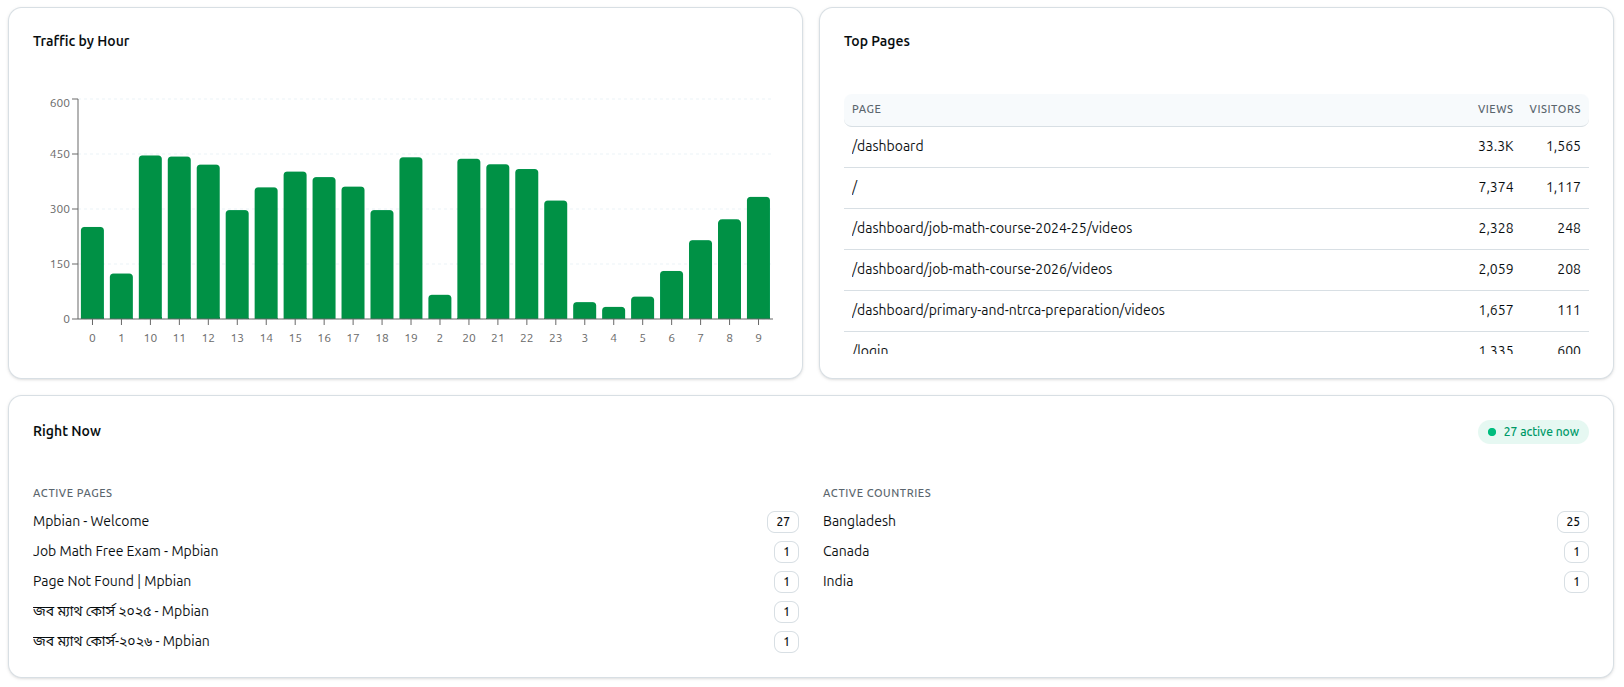
- Traffic by Hour — a bar chart of visitors by hour, so you can see when your site is actually busy.
- Top Pages — your most-viewed pages, ranked by views and unique visitors.
- Right Now — appears only while visitors are currently active. Shows the pages and countries they're on this second, refreshed automatically every 30 seconds.
Audience Tab
Who is visiting, and from where:
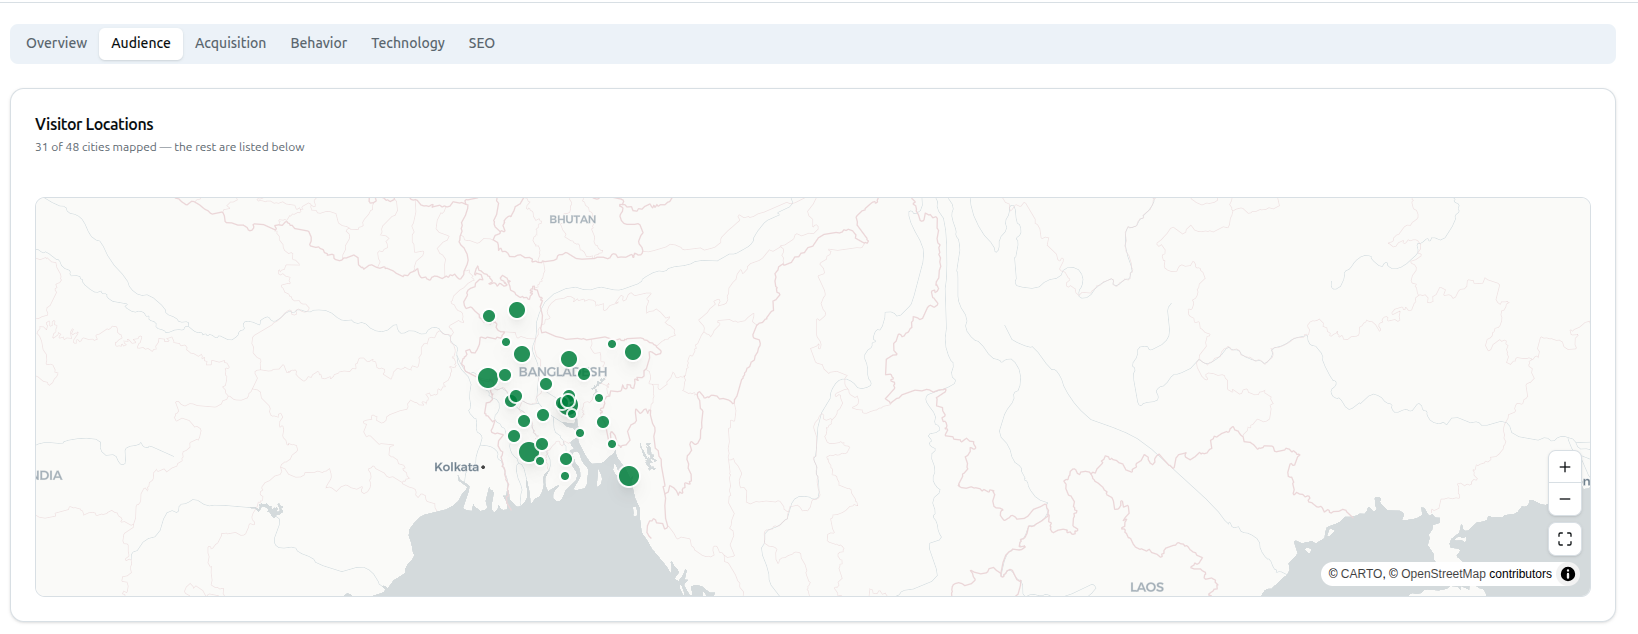
- Visitor Locations — an interactive map plotting every city with known coordinates.
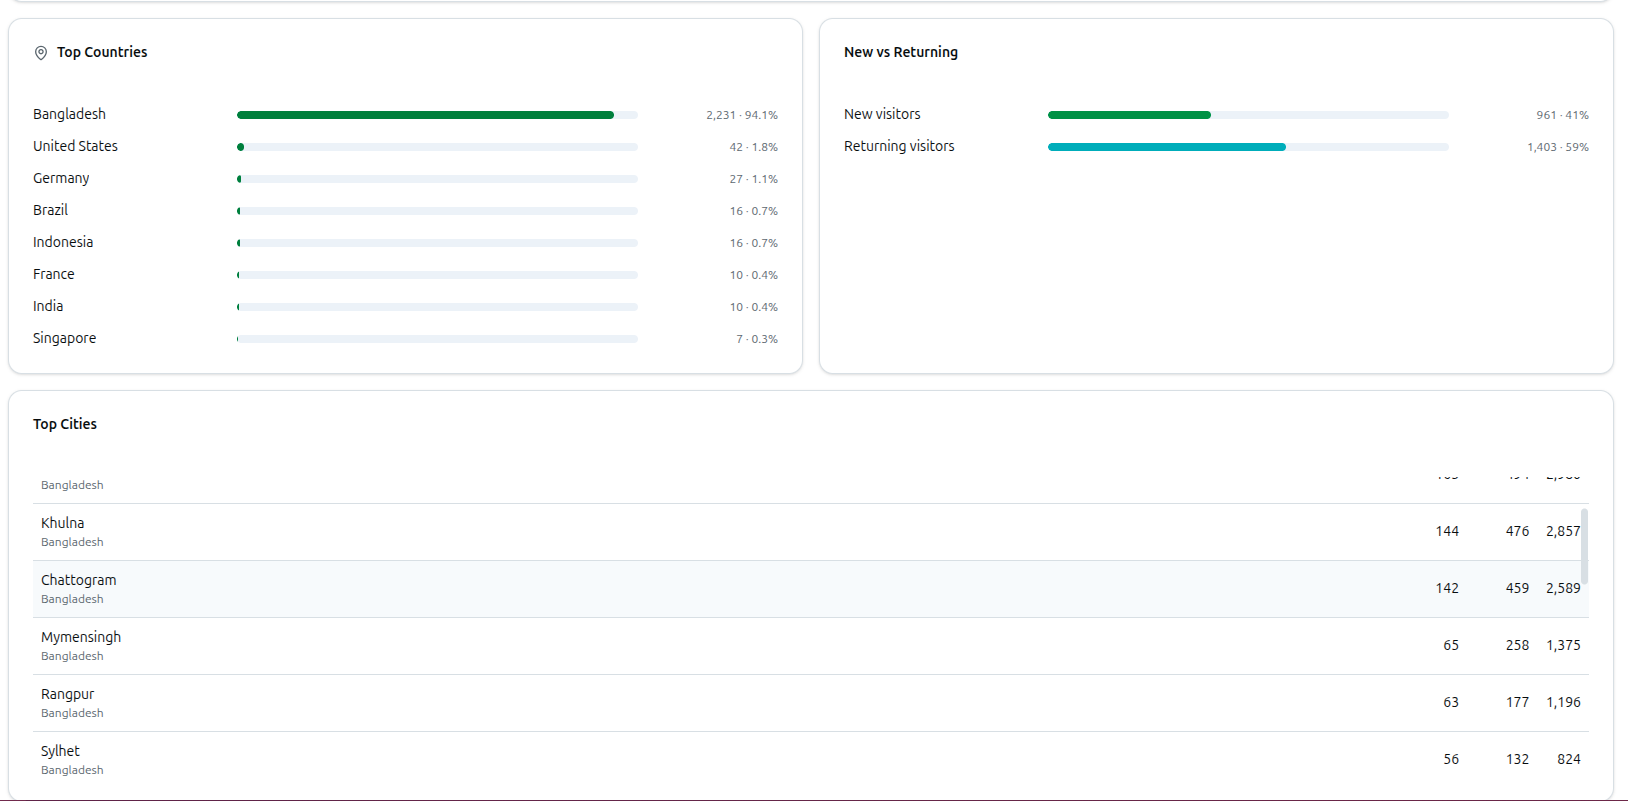
- Top Countries — your top visitor countries as percentage bars.
- New vs Returning — what share of visitors are first-timers versus people coming back.
- Top Cities — a ranked table of your top 20 cities by visitors, sessions and views.
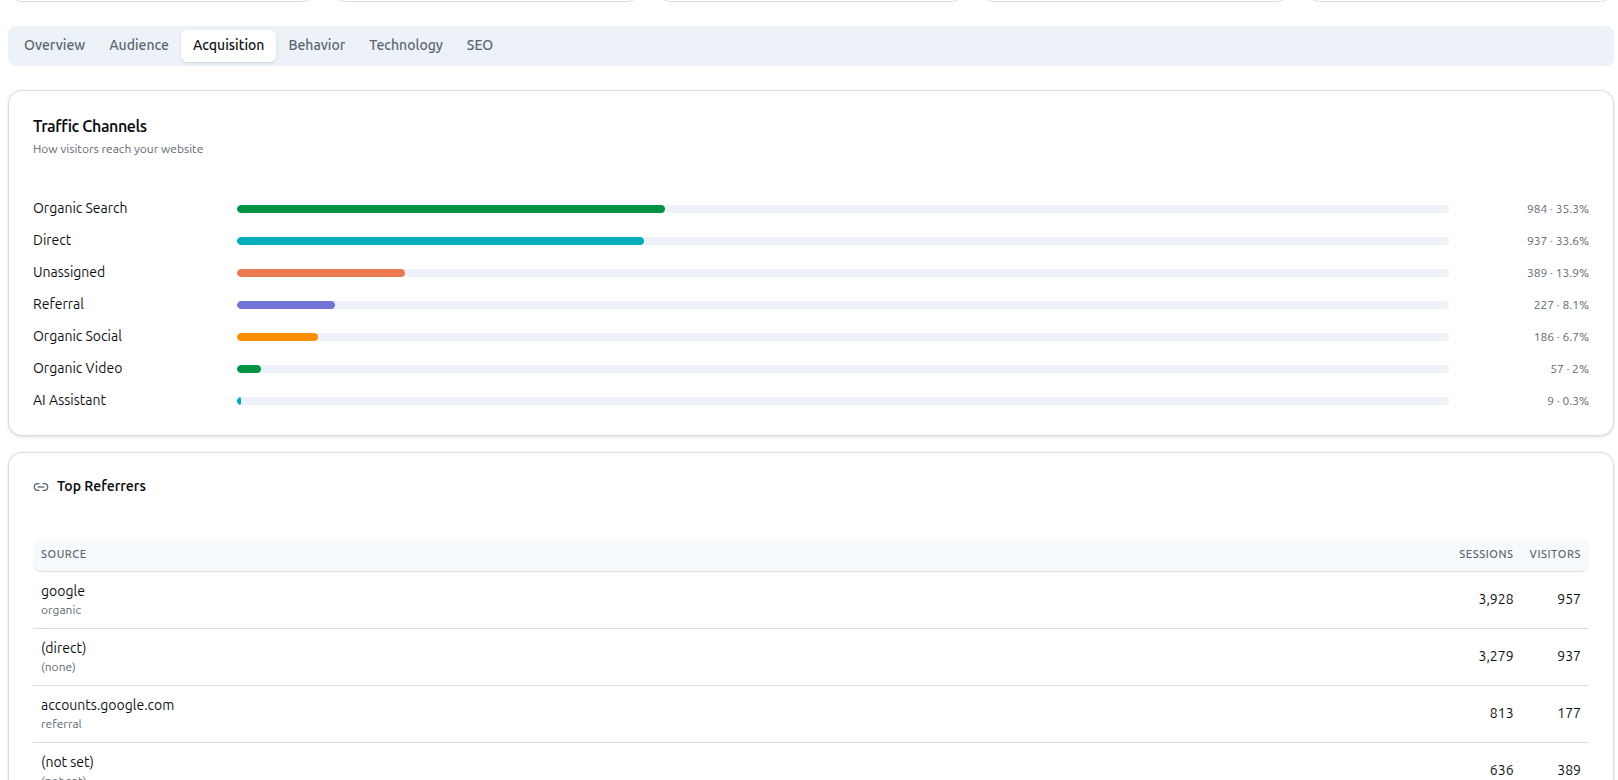
Acquisition Tab
Where your traffic actually comes from:
- Traffic Channels — the share of visitors arriving via search, direct visits, social, referral links, and so on.
- Top Referrers — the specific outside sites and links sending you visitors.
Behavior Tab
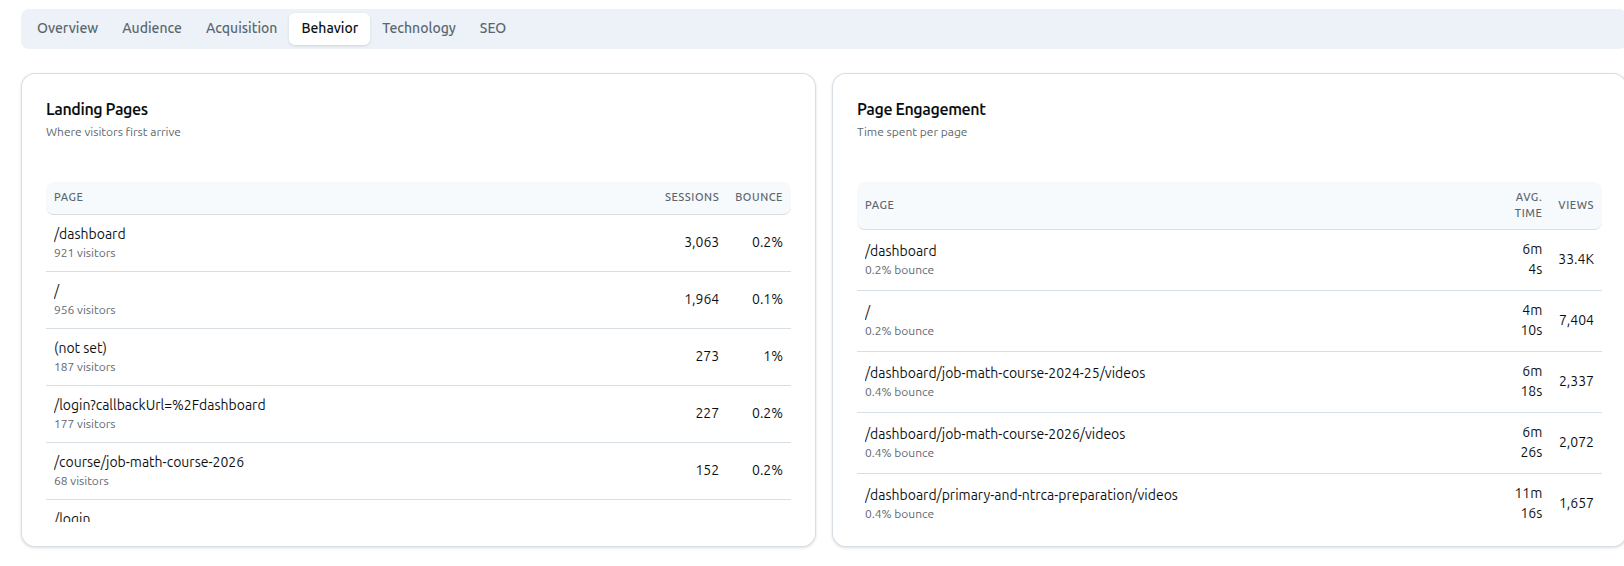
What people do once they land:
- Landing Pages — the pages people first arrive on, with sessions and bounce rate for each.
- Page Engagement — average time spent per page, alongside its bounce rate.
Technology Tab
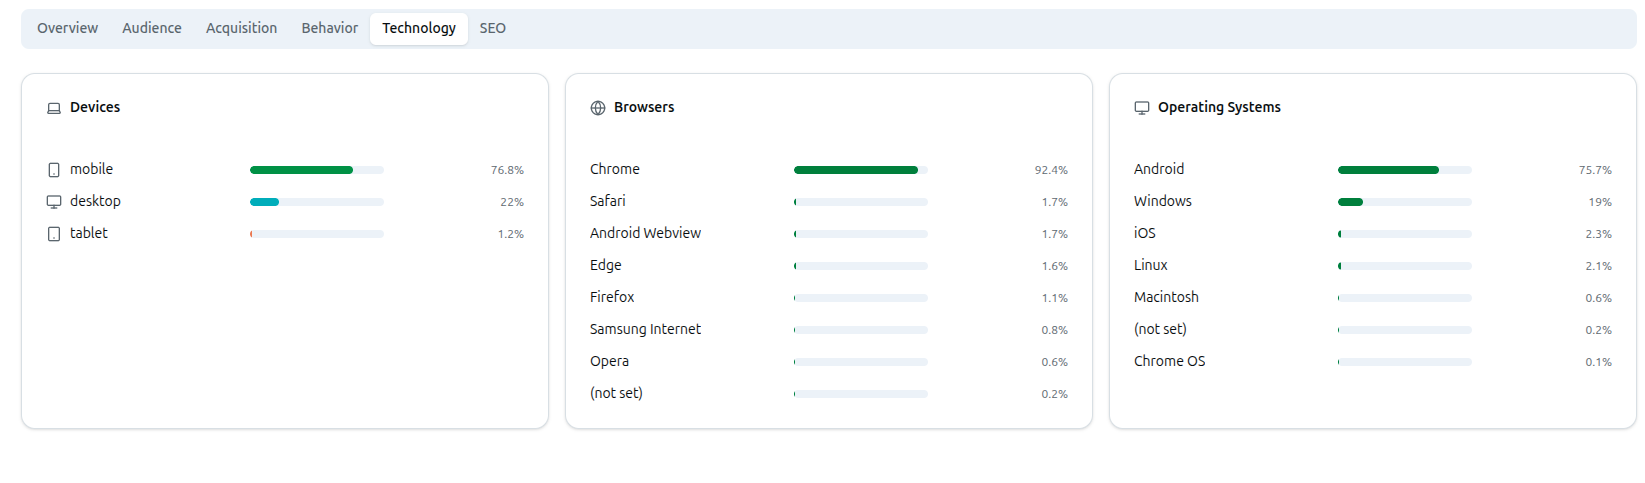
What your visitors are browsing with — Devices, Browsers and Operating Systems — each as a simple percentage breakdown. Useful for knowing, for example, how many students are on mobile versus desktop.
SEO Tab
Two separate tools live here, each needing its own connection.
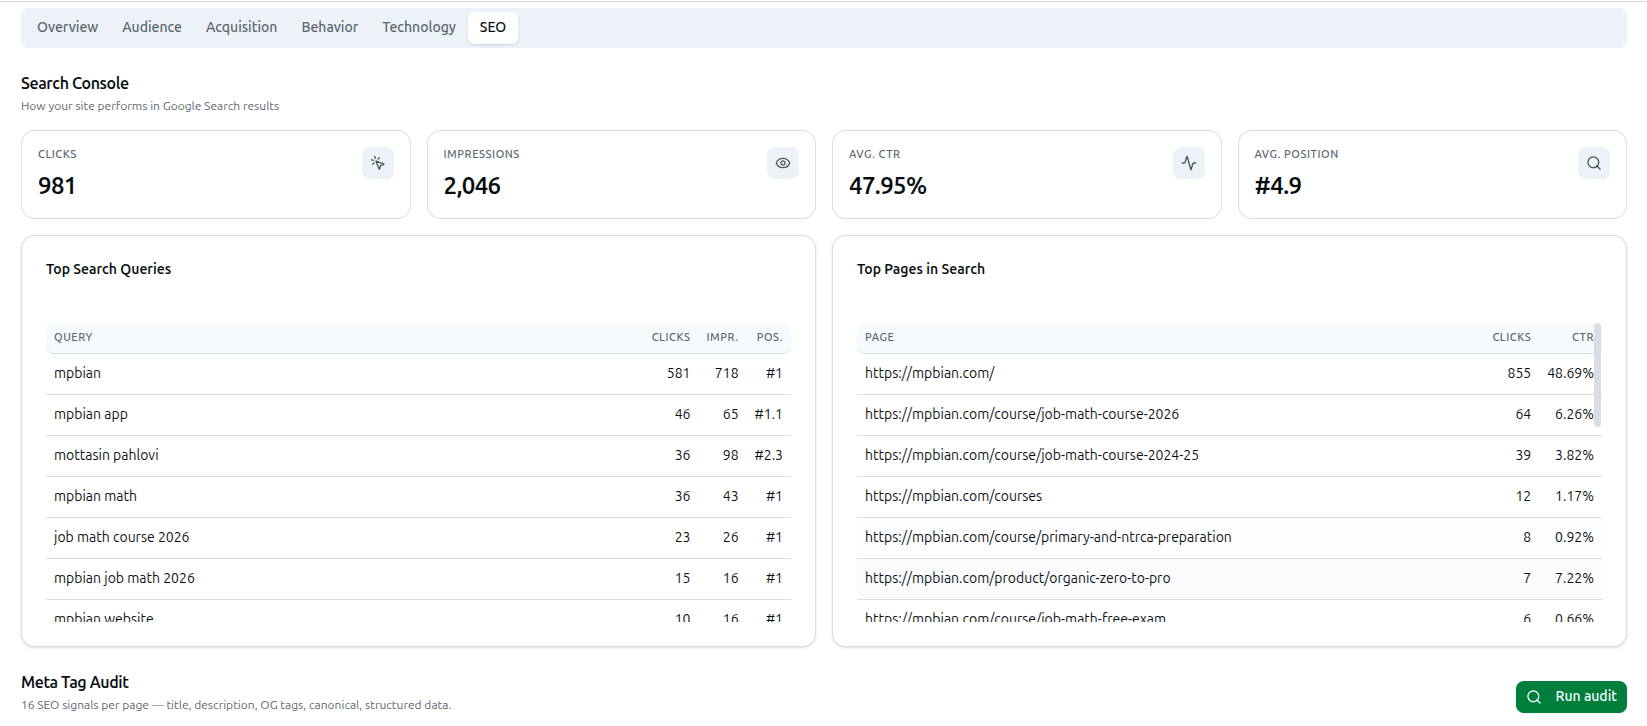
Search Console — how your site performs inside Google search results (this needs Google Search Console connected, separately from GA4):
- Four numbers: Clicks, Impressions, Avg. CTR (click-through rate) and Avg. Position (your typical ranking spot).
- Top Search Queries — the actual words people typed into Google before landing on your site.
- Top Pages in Search — which of your pages show up in search results most.
Meta Tag Audit — a page-by-page technical SEO check, independent of Search Console. Click Run audit — it does not run automatically — to scan your pages for 16 SEO signals: title tags, meta descriptions, Open Graph tags (how your links look when shared), canonical tags, and structured data.
Once it finishes, you get an overall score (0–100) plus Passed, Warnings and Failed counts across every check, and a Fix these first list sorted so the most urgent problems are on top. Click any page in the list below it to expand its full 16-point checklist — each item shows a pass/warning/fail icon, a priority tag, what was found, and, if it needs work, exactly what to change.
If Nothing Is Connected Yet
Google Analytics isn't connected shows in place of the whole page until GA4 is set up. To fix it: open Integrations → Google Analytics, enable GA4, paste your Tag ID (looks like G-XXXXXXXXXX) and Property ID (looks like properties/123456789), then grant Viewer access to the Course37 service account. A Run a connection test link on the same screen lets you test the connection before leaving Integrations.
Search Console isn't connected shows only inside the SEO tab, independently of GA4 — the rest of the page works without it. To fix it: open Integrations → Google Search Console, enable it, set your site URL (for example sc-domain:example.com), and grant the Course37 service account access there too.
Full guide: Configure Analytics & Authentication Integrations
Troubleshooting
| What you see | What it means |
|---|---|
| Google Analytics isn't connected | GA4 isn't set up yet, or the connection details are wrong — see If Nothing Is Connected Yet above |
| Couldn't load analytics | GA4 is connected but the request failed. Click Try again, or run the connection test for details |
| Search Console isn't connected | This affects only the SEO tab's Search Console section — connect it separately from GA4 |
| A tab looks mostly empty | Normal for a new or low-traffic site, or for a period with little activity — try a longer Reporting period |
| Right Now card is missing | It only appears while someone is actively on your site — refresh in a moment |
| SEO tab shows nothing under Meta Tag Audit | You need to click Run audit — it doesn't scan automatically |