
How to Review Website Analytics Preview
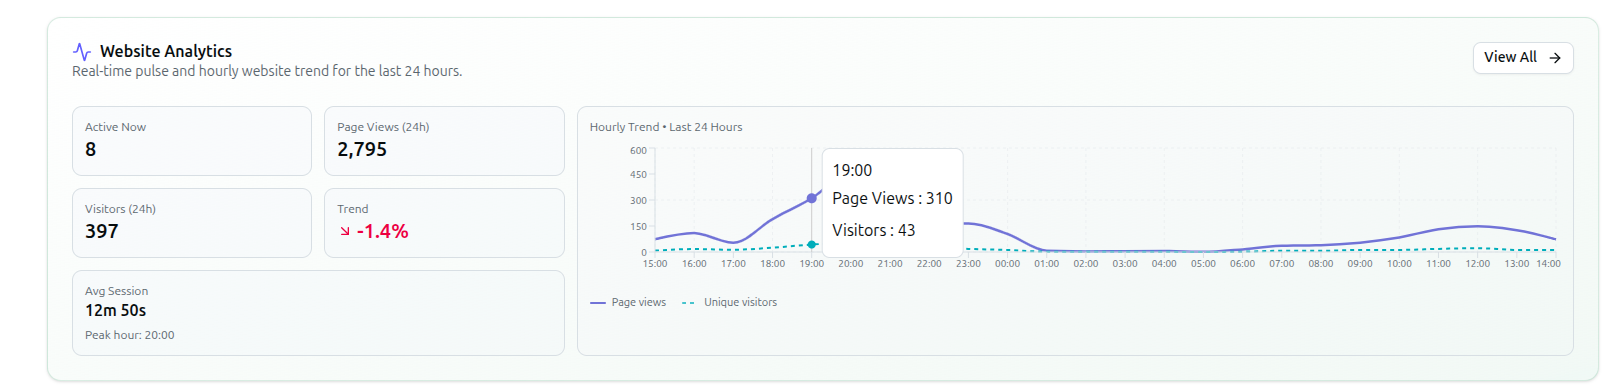
The Website Analytics card on the dashboard gives you a 24-hour traffic snapshot without leaving the page.
- The card shows five stat tiles:
- Active Now — current live visitors on your website
- Page Views (24h) — total page views in the last 24 hours
- Visitors (24h) — unique visitors in the last 24 hours
- Trend — percentage change in page views (green for positive, red for negative)
- Avg Session — average session duration from the last-7-days GA4 overview, with the Peak hour (the hour with the most page views in the last 24 hours) shown just below it in the same tile
- A Hourly Trend line chart displays page views (solid indigo line) and visitors (dashed teal line) for the last 24 hours. Hover over any point to see the exact page views and visitor count for that hour
- Click the View All button to navigate to the full Website Analytics page at
/dashboard/website-analytics
If Google Analytics is not connected (or returns no data), the card instead shows "No website analytics yet" with the message "Connect Google Analytics 4 to see visitors, page views, and live traffic here." and a Connect Google Analytics button that opens the Integrations page.
Related: Dashboard Analytics Overview — Full dashboard walkthrough · How to Use Website Analytics — the full page behind View All