
The Analytics tab measures how one course is actually going — who is engaging, who is falling behind, and where content is being ignored.
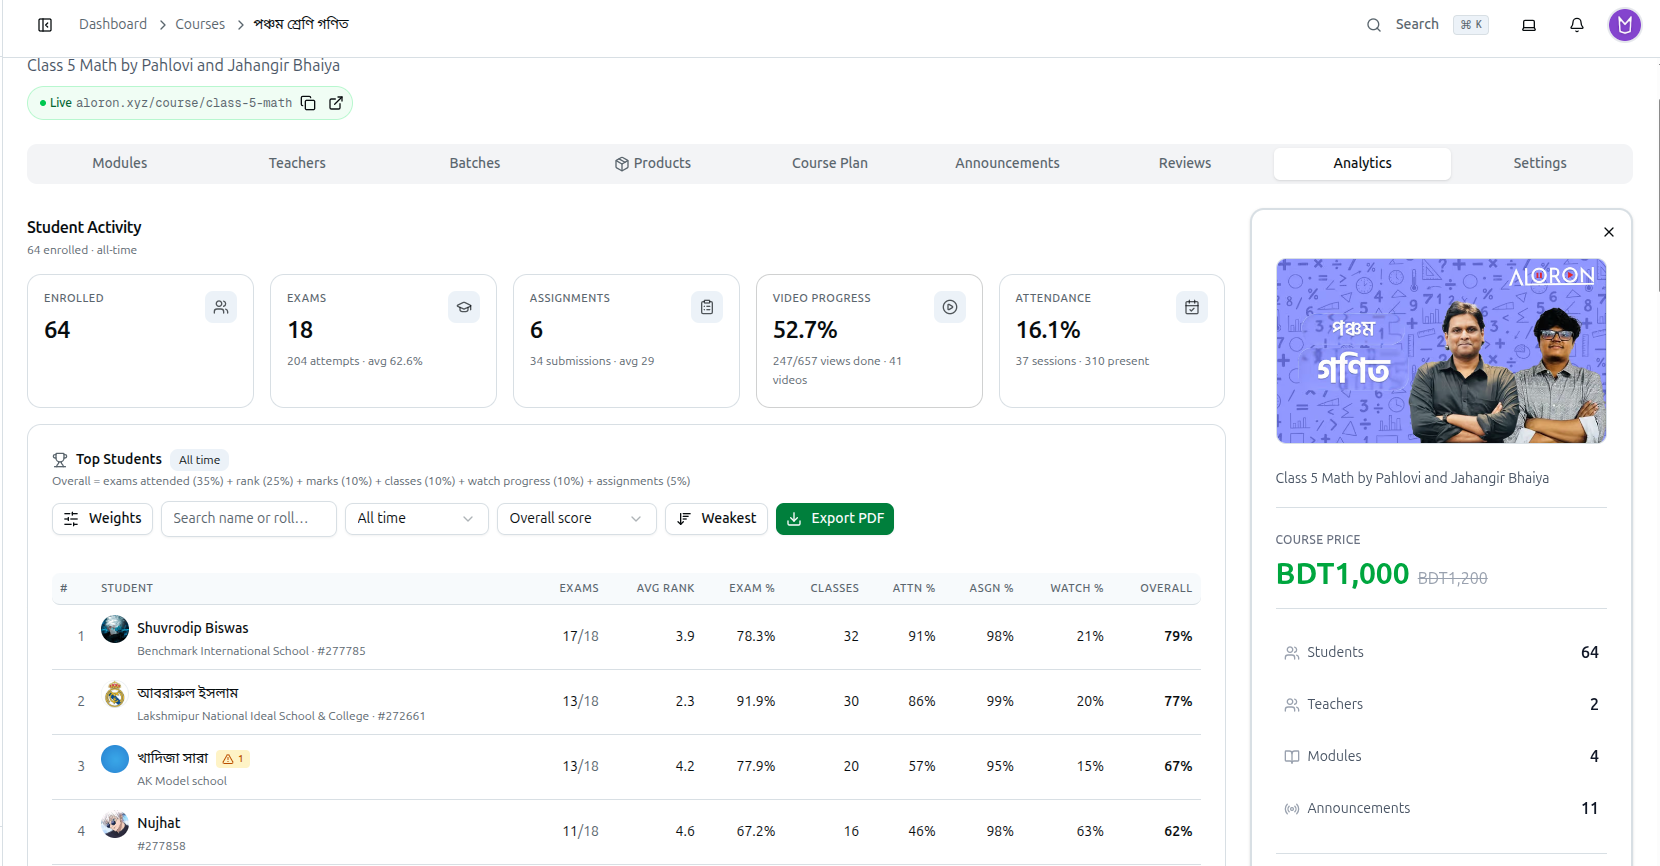
Open a course and click Analytics. Close the info panel with its × to use the full page width — this tab is wide.
Student Activity
Five cards summarise the whole course, headed with how many are enrolled and the period covered — 64 enrolled · all-time.
| Card | What it tells you |
|---|---|
| ENROLLED | Total students on the course |
| EXAMS | How many exams exist, with total attempts and average score |
| ASSIGNMENTS | How many assignments, with submissions and average marks |
| VIDEO PROGRESS | Percentage of all possible views completed, as views done / total across your videos |
| ATTENDANCE | Percentage attended, with sessions held and total present |
Read VIDEO PROGRESS as coverage, not effort. 247/657 views done · 41 videos means: across 64 students and 41 videos, 247 of 657 possible view-completions have happened. A low figure usually means later videos are untouched, not that students are lazy.
Top Students
The leaderboard ranks everyone by a single Overall score.
How Overall is calculated
The formula is stated above the table. By default:
| Component | Weight |
|---|---|
| Exams attended | 35% |
| Rank | 25% |
| Marks | 10% |
| Classes | 10% |
| Watch progress | 10% |
| Assignments | 5% |
Turning up counts for more than scoring well. Exams attended at 35% is the single largest component, and marks is only 10%. This ranks consistent participation above raw ability — deliberate, but worth knowing before you treat the list as a ranking of your strongest students.
Adjusting the weights
Weights opens a panel where you can change every component and reset to defaults. If attendance does not matter for an online course, set classes to 0 and the weight moves elsewhere.
Reading the table
| Column | Meaning |
|---|---|
| # | Rank position |
| STUDENT | Photo, name, institution and roll number |
| EXAMS | Exams attended out of exams available, such as 17/18 |
| AVG RANK | Average position across exams — lower is better |
| EXAM % | Average exam score |
| CLASSES | Classes attended |
| ATTN % | Attendance percentage |
| ASGN % | Assignment completion |
| WATCH % | Video watched |
| OVERALL | The weighted composite |
Finding specific students
- Search name or roll… — jump to one student.
- All time — change the period.
- Overall score — change what the table sorts by.
- Weakest — flip the order to surface students who need help. This is the most useful button on the page: the same data, read as an intervention list.
- Export PDF — download the leaderboard to share or print.
Spotting Problems
The columns are most useful read against each other:
- High EXAM % but low WATCH % — they already know the material, or they are getting answers elsewhere.
- High WATCH % but low EXAM % — engaged but struggling. The clearest candidates for help.
- Low ATTN % with good marks — self-studying; attendance rules may not suit them.
- A whole course with low WATCH % — the content, not the students. Check whether later modules are too long or poorly ordered.
Troubleshooting
| What you see | What it means |
|---|---|
| ATTENDANCE is very low | Sessions were held without attendance being taken, or this is an online course where it does not apply |
| VIDEO PROGRESS looks impossibly low | It counts every student against every video. Recently added videos drag it down |
| A student is missing from the leaderboard | Search by name or roll — the table pages |
| OVERALL does not match your expectations | Check the weights: exams attended is 35%, marks only 10% |
| The tab feels cramped | Close the info panel with its × |
Related: Managing Course Details · Create and Grade Assignments